
")
In May, the Local Infrastructure Hub hosted a webinar focused on Using Data to Secure Infrastructure Investment, a resource that provides insight and guidance to cities on taking an outcomes-driven approach to infrastructure projects. This resource looks at how the City of Carlsbad, California is putting these strategies into practice to connect the dots between problems and solutions, guide project design, and monitor outcomes.
In January 2020, Carlsbad, California adopted the Connected Carlsbad: An Inclusive City Innovation Roadmap to set goals and a strategic action plan for creating a digitally connected city that leverages integrated technologies to improve civic engagement, data-driven decision making, accessibility, and transparency. Connected Carlsbad promotes technology adoption and integration across the City’s offices in order to de-silo departmental data and leverage to improve the functionality of the whole city – including its infrastructure and built environment. The Connected Carlsbad Roadmap lays out five key goals for its implementation:
- Pursue community wide digital transformation
- Build capacity for data-driven decision making
- Foster a vibrant civic engagement culture
- Enhance accessibility and transparency
- Promote security and sustainability through connectivity
Recognizing the critical importance of data in policy making, David Vangilluwe, Chief Data Officer for the City of Carlsbad, said “datasets need to reaffirm what we are seeing and help us see what we can’t see.” In the years to follow, Connected Carlsbad and Vaguilluwe’s team would implement data-driven decision making and the five pillars of the roadmap to improve the city’s roadway safety infrastructure.
Traffic Safety in Carlsbad
The Carlsbad City Council declared a state of emergency for traffic safety in August 2022 following a 233% increase in collisions involving bikes and e-bikes between 2019-2022, including two fatal accidents in just 17 days. The declaration found e-bikes, which are heavier and faster than standard bicycles, were increasingly being used by school age children for recreation and to commute to and from school. With just days before the onset of the next school year set to cause a significant uptick in local road use, city leaders intended to use the declaration to stave off any unnecessary collisions, injuries or further deaths. The state of emergency increased both attention and available resources for addressing traffic safety, allowed the City to expedite responsive action and bypass bureaucratic processes that might impede implementation. Carlsbad was determined to take advantage of this opportunity to enact a data-driven approach to solving the City’s road safety challenges.
In this resource, we focus on how Carlsbad took a data-driven approach to addressing their traffic safety challenges by following five critical steps:
1. Define Outcomes
Reducing Collisions for All Carlsbad Roadway Users
At a high-level, the intended outcome for traffic safety interventions is clear: reduce the number of collisions to make the roads safer for all users. In Carlsbad, local leaders also did a more granular analysis of the specific risks and incidents involving cyclists throughout the City. The focus on risks to both pedal bike and e-bike users informed data needs, as well as the interventions Carlsbad took to achieve their goals.
2. Incorporate Data into Project Design
Breaking Down Carlsbad’s Data Silos and Building a Data-Driven Story of Need
At the beginning of the City’s journey, local leaders recognized the need to build both the data infrastructure and the governance practices to support data-driven decision making. As Carlsbad’s Vangilluwe said, turning traffic safety concerns into action is “not just gut instinct and reaction, but needs to be more evidence-based policymaking.”
Through a citywide data assessment the City’s Data and Analytics Team found that various departments across the City relied upon similar datasets for their day-to-day work but were not sharing data with each other, creating silos that hinder holistic response.
For example, the City’s Planning Department used collision data from the National Highway Traffic Safety Administration (NHTSA), which can offer comparative trends and safety benchmarks. However, due to the national aggregation of this data, the data is delayed in reaching the field, and it can be difficult to use for observations and reporting month-to-month trends. Through their citywide data assessment, the Carlsbad team recognized that this data was actually sourced from the City’s Police and Fire Departments (before it went to NHTSA). By creating a path for this data to get to the Planning Department locally, the team could get more real-time data. In addition to breaking down these internal silos, the City also added traffic flow data from third-party sources, like Google, Waze, and HERE, to track average travel speeds against posted limits.
In an interview with Vangilluwe and Rachel Maltz, Senior Program Manager for Data and Analytics for the City of Carlsbad, Vangilluwe called out the importance of breaking down the City’s data silos: “All of that data can inform decision-making around where we should treat certain streets, what we should do around speed limits, illustrate past precedents, and show what will make the most impact.”
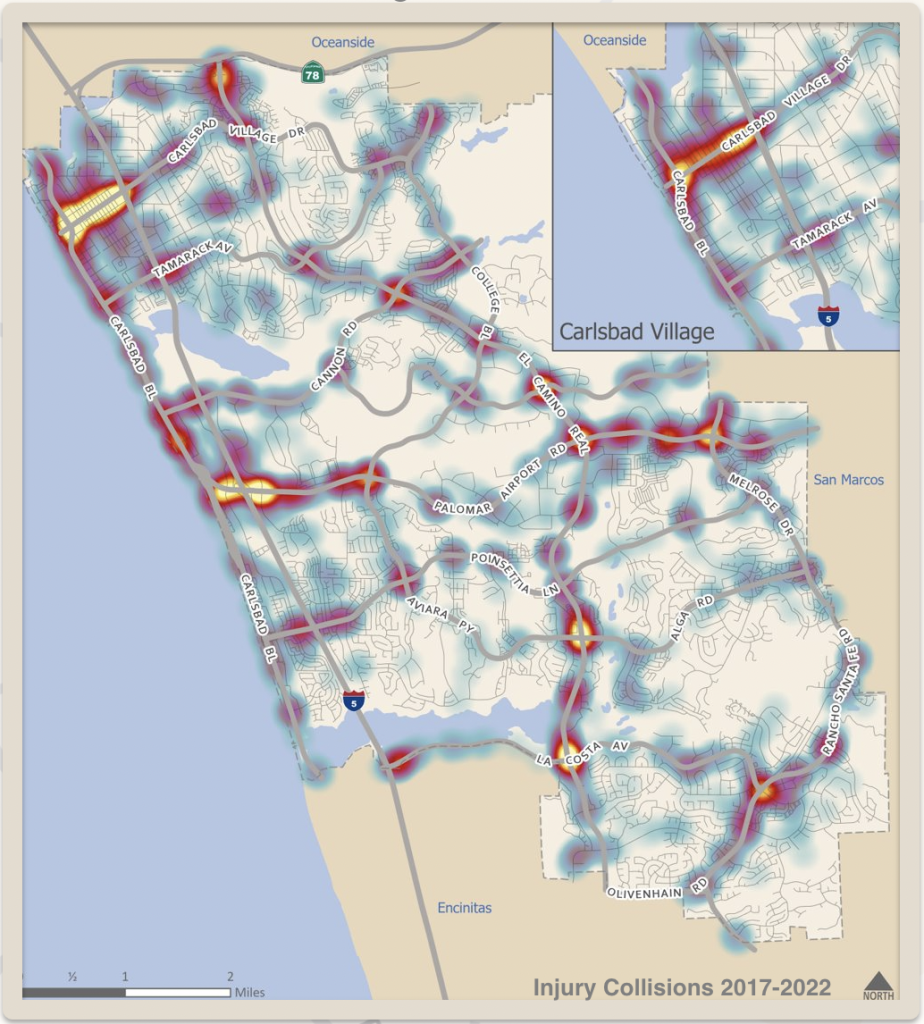
But to fully leverage the potential of data, the Data and Analytics Team had to connect the dots and tell a story with the data that would illustrate the safety challenges for road users as well as stakeholders, including City Councilmembers, staff from various departments and community organizations. The data team started by creating heat maps to show where injury-causing collisions had occurred over a five year period, allowing City staff across departments to identify the most dangerous intersections and orient interventions around them. These maps, as well as others developed for the County’s Vision Zero plan, helped to foster more specific conversations around traffic safety in the City. The maps and ensuing conversations were imperative in driving the implementation of their strategy built on “the three ‘Es’ of traffic safety” – Engineering, Enforcement, and Education.
Collecting data also involves making sure that the City is collecting the right data and at a discrete level of usability. In Carlsbad, they found that all bike accidents were categorized under the same code – which did not shed light on how the accidents differed in any number of variables. As a result, the City created new data codes for categorizing these traffic incidents to better differentiate and track which bike-related incidents involved e-bikes as opposed to traditional pedal bikes.
3. Implementation and Monitoring
Leveraging the Connected Datasets to Pave a New Path Forward for Carlsbad
Using the heat maps to identify the most dangerous intersections for cyclists, the City, working across departments, deployed enforcement, engineering, and education strategies to change driver behaviors, raise awareness and create a safer street system.
For example, the Transportation Department found that Carlsbad’s traffic signals relied upon insufficient wireless technology to transmit the data necessary to properly adjust to real-time traffic patterns. The lag often led to increased traffic congestion in key corridors and elevated the risk for collisions. By investing in a high-speed fiber network, the signals can now more rapidly adjust based on incoming data from other connected signals, improving traffic flow and increasing safety. Additionally, the Transportation Department connected bluetooth readers to signals across 37 of Carlsbad’s busiest intersections. The bluetooth readers can quickly alert Department staff at their traffic control center if an intersection is suddenly experiencing unexpected slowing, allowing for manual adjustment to the signalization.
To address the growth in e-bike use, the City’s police, transportation and community development departments collaborated to raise awareness and share safer driving practices by presenting at schools and community events. The Carlsbad Police hosted quarterly bike and e-bike safety classes, which quickly reached capacity as more and more residents saw the need and value for them and their children. The City organized regular pop-up events and activations at community hubs like schools, parks and libraries to provide additional engagement opportunities for families and children on e-bike safety.
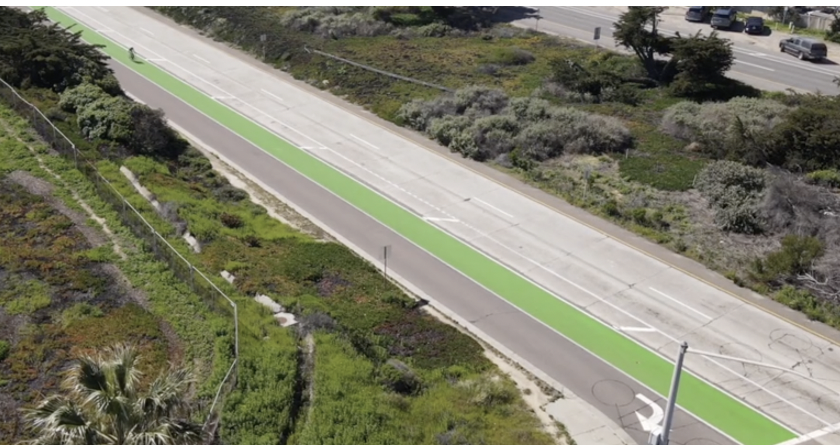
Physically, the City made bike lanes more visible by adding green paint in high-risk areas. The green paint makes drivers and bicyclists more aware of each other as they share the road. The increased visibility, along with the City’s education and engagement efforts, are both consistent with the Safe System Approach, which is an evidence-based framework for improving road safety that has been adopted by other cities to eliminate traffic-related fatalities. Data-informed implementation helped improve traffic safety for all road users in Carlsbad and contributed to the decrease in injury-causing collisions.
As Rachel Maltz shared in the Local Infrastructure Hub Webinar referenced at the top of this resource, it was important for the City to blend data they were tracking with community input to drive continuous improvement in traffic safety. This required cross-departmental collaboration and continuous community engagement to run in tandem with data tracking to ensure that local leaders had a clear picture of what was happening on the ground, as well as what pivots might need to be made to resolve the defined challenge.
4. Evaluate Results
Data-driven Investments Yield Results
In February 2023, the City shared early data demonstrating the impact of the adopted interventions and trends in traffic safety in the City. The data showed that unsafe speeds were the leading cause of crashes that month, which helped the City to educate and raise awareness for safe driving behaviors. The City further used this data to inform the adoption of various engineering and design solutions to promote slower speeds and better safety outcomes, including restriping lanes, raised medians, curb extensions, rumble strips, roundabouts and the aforementioned green bike lanes.
Since declaring the local state of emergency in 2022 and investing in these interventions, Carlsbad has seen many promising trends, as noted by Maltz in the summer of 2025, including:
- Reductions in injury collisions in high-risk zones where infrastructure improvements and educational efforts were focused.
- Slower average vehicle speeds in corridors where traffic calming measures and street redesigns were implemented.
- Improved visibility of crosswalks, sidewalks, and bike lanes, leading to more predictable pedestrian behavior.
In addition to evaluating results internally, the City also works to ensure that their data is open and accessible to the community, which promotes both transparency and accountability. The open access data platform also enables others to apply various analytical and evaluative approaches, potentially finding new insights that might otherwise not be observed. For example, academic researchers can use speed data and incident trends to inform academic projects or public awareness campaigns; media and community members can use data visualizations to stay informed on high-risk areas and understand the City’s investments; and, regional partners can coordinate on shared safety priorities and funding strategies based on open and shared datasets.
5. Use Results to Inform Future Projects
Carlsbad’s Paradigm Shift and a Data-Driven Future
Evidence-based policymaking is a full-circle approach. Data collected across offices and departments, as well as data-driven best practices like the Safe System Approach, inform the design and implementation of a given policy intervention. Then, the outcomes of those interventions continuously inform new iterations as the community responds. Maltz spoke to this point, sharing that Carlsbad’s Data and Analytics Team is constantly collecting and assessing data on their traffic safety interventions to identify what is working and where problems persist geographically. With those assessments in hand, the City can prioritize projects more effectively – addressing the most at-risk corridors and intersections in real time. Simultaneously, the City is making this data available to the City Council and, even more importantly, to their residents, to guide long-term policy making, capital planning and make sure that everyone in Carlsbad has a role to make the City safer for all.
Accelerator for America would like to thank Drexel University Nowak Metro Finance Lab for their partnership in production of this case story for the Local Infrastructure Hub.
